
Object Storage at NVMe speed, tested a billion ways
Until recently, every Hotdata query read Parquet files from S3 through Mountpoint over FUSE, which also served as our cache. We saw an opportunity to push performance further by rethinking how we access and cache data.
So we built a new cache, Inertia: a small daemon that shares one block cache across every query engine worker on a node. Instead of serving bytes, Inertia hands the worker an open file over a Unix socket, and the worker reads the data itself. Given the high risk of this system, we wanted to feel confident in its reliability. We built it with deterministic simulation testing (DST), which replays any failure exactly from a seed. Separately, we load-tested the query engine on real hardware with Inertia, Mountpoint, direct S3 and local NVMe as storage backends.
In this post:
- Why we replaced Mountpoint
- Letting workers read cached files directly
- Performance results
- Testing failures in simulation
- Checking that the simulator works
- What the failures taught us
- What the load tests caught
- What comes next
Why we replaced Mountpoint
We chose Mountpoint because AWS built it, and we expected it to be the best option for serving S3 data from local disk. It mounts S3 as a disk and keeps a local NVMe cache with eviction handled for us, so queries could reuse data they had read recently. As traffic grew, it ran into three problems:
- Cache hits were slow. Every cached read still crossed FUSE, with a context switch and a copy on each request. That is why cached reads ran three times slower than local NVMe.
- The cache had no file awareness. It treated Parquet footers like any other block, so large scans evicted the small reads every query starts with, and the next query fetched them again.
- Performance suffered under pressure. Once the working set exceeded the cache, eviction churn cost more than the hits saved, and reading S3 directly beat the cache.
We wanted a cache that knew it was holding Parquet files and protected their footers and page indexes from eviction when large scans filled the cache. It also had to share data across the query engine workers on a node and let each worker read directly once the data was local. Nothing off the shelf did all three, so we decided to build our own.
Letting workers read cached files directly
We built Inertia around a simple idea: warm data should be read as fast as the underlying disk storage (NVMe, in our case). Unix already lets one process pass an open file to another over a Unix socket. Inertia runs as one daemon on each node. The daemon manages block files on local disk and passes open files to the query engine workers that need them. The workers read directly from those files, avoiding FUSE and the need to copy bytes through the daemon.
Every worker on the node shares that one daemon, including old and new workers running together during a rollout. S3 remains the source of truth, so losing the cache or the entire node loses no data.
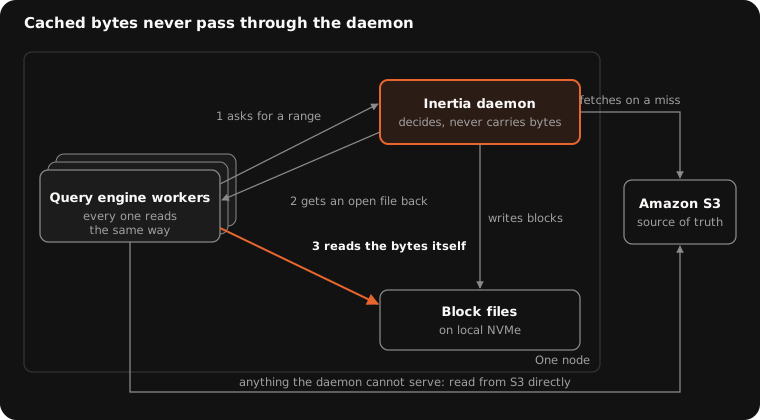
The worker asks the daemon for a byte range and says how long it can wait. Before that deadline, the daemon answers with an open file covering whatever it holds, and names any part it could not serve. The worker fetches only that missing part from S3 and keeps what the daemon provided. When a disk runs slow, the fetch queue fills, or an S3 request stalls, the daemon returns what it has and lets the worker fetch the rest. It never makes a worker wait.
The second design choice protects Parquet metadata, the footers and page indexes every query reads first. The worker tags those requests as metadata, and the daemon stores them in a separate budget that scan data cannot touch. A large scan can no longer evict the metadata that every query needs.
We did not design the S3 side from scratch. AWS publishes detailed guidance on getting the best throughput from S3, along with a reference implementation in its high-performance CRT-based S3 client: read ahead along sequential scans and fetch byte ranges in parallel. The Inertia daemon follows the same approach. For testing, we drew on mutation testing and the deterministic simulation work of FoundationDB and TigerBeetle.
Security also shaped the design from the start. Sharing one daemon across workers must preserve the same access boundaries as the query engine: a worker should only read data it is authorized to access, whether that data comes from S3 or local NVMe.
Performance results
We ran the same query engine build and the same queries on four identical EC2 hosts in the same placement group, all at the same time:
- Mountpoint, our existing cache.
- Inertia.
- Direct S3 access without a cache.
- Local NVMe, as the performance baseline.
Each setup read the same 128 GB dataset: about one billion rows across 90 daily Parquet files, with a 48 GiB cache for both Mountpoint and Inertia. A separate host sent the queries, which ranged from one day of data to all 90 days.
The test ran in four stages, each asking a different question:
- First reads, then cached reads. The same 45 queries ran twice, once with nothing cached and once with every file already read.
- Fresh data under concurrency. Queries over unread data at one, four and eight at a time, 6, 16 and 23 queries respectively.
- Cache pressure. Working sets larger than the cache, each stage running for a fixed 10 to 15 minutes.
- Production-shaped traffic. A replay of 3,000 to 9,000 queries per stage with the query engine’s in-memory cache on, including a daemon restart and two workers sharing one daemon.
Only two stages ran with the 4 MB S3 requests the cache uses today. The rest ran with the earlier 16 MB requests, which were slower wherever we measured both, so most of the numbers below understate the current build.
Once the cache held the data, queries through Inertia took about as long as reads from local NVMe, and never went back to S3. Four further warm passes held a median of 64 to 65 ms with zero bytes read from S3.
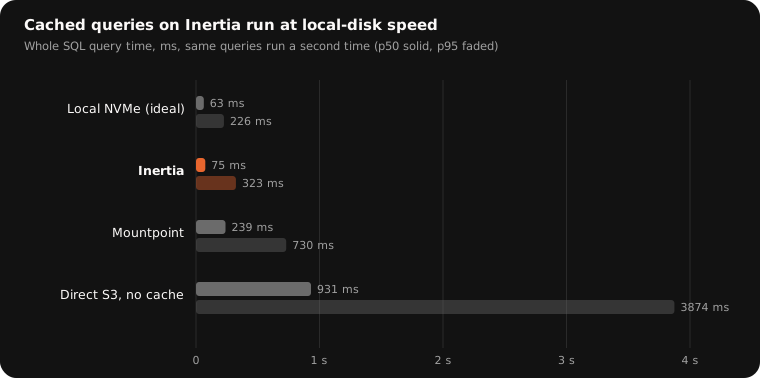
Cold data showed the same pattern. Inertia ran two to three times as fast as both direct S3 and Mountpoint at one, four and eight concurrent queries. At eight, the median query took 7.2 s through Inertia against 13.5 s through Mountpoint and 16.0 s from direct S3. Inertia’s median first-read latency was close to direct S3, 842 ms against 869 ms, and far better at the 95th percentile:
| Condition | Inertia | Mountpoint | Direct S3 |
|---|---|---|---|
| First read, 95th percentile | 1.3 s | 3.8 s | 4.7 s |
| Queries completed in 15 minutes, data larger than the cache | 1,668 | 299 | 317 |
The cache-pressure stage reports query counts rather than times because the local NVMe host ran at 87% CPU there, so its latencies measured CPU rather than storage.
Disk reads were fast too. After we cleared the operating system’s memory cache, the median cached query took 78 ms through Inertia, compared with 83 ms on local NVMe and 300 ms through Mountpoint.
With the query engine’s in-memory cache enabled, as in production, the gap narrowed at the median but stayed open at the tail. On the production-shaped replay, the median was 45 ms through Inertia, 42 ms through Mountpoint and 70 ms from direct S3, while the 95th percentile was 106 ms, 248 ms and 1.6 s. With two workers sharing one daemon, the median query took 43 ms through Inertia and 66 ms through Mountpoint. Restarting the daemon or a worker caused no lasting slowdown.
The cache also cut what we pulled from S3:
| Condition | Inertia | Mountpoint | Direct S3 |
|---|---|---|---|
| First read of every file | 6.3 GB | 20.6 GB | 11.8 GB |
| Same queries, cache warm | 0 GB | 0.02 GB | 11.9 GB |
| Production-shaped replay | 1.2 GB | 6.1 GB | 72.6 GB |
| Two workers sharing one daemon | 2.7 GB | 21.0 GB | 164.6 GB |
One caveat on the table. With a 2 GiB cache Inertia pulled more from S3 than direct S3 did, because read-ahead fetched blocks nobody then read. We have since removed most of that waste, but not all of it.
We also compared the same query engine build on two production nodes holding the same data, with the query engine’s in-memory cache disabled so storage performance stood on its own. Inertia was faster on every query tested. Cached queries ran 12 to 35% faster, first reads of queries scanning most of a table ran 1.5 to 2.8 times faster, and the query engine used 21% less CPU.
Testing failures in simulation
Those numbers only matter if the cache is correct, and a shared cache fails in many ways. Workers crash, daemons restart, disks fill up, and S3 requests stall or fail. The hardest bugs appear when several of these things happen together.
We use deterministic simulation testing to explore those combinations. The real cache logic runs inside a simulated environment containing workers, daemons, disks, clocks and S3. Every random choice comes from a single seed, so one seed is one complete scenario: a schedule of crashes, delays and failures, with every read checked against S3. Replay the seed and the failure reproduces exactly.
To make this possible, we split the cache’s decisions from its interactions with the outside world. The core logic never touches a socket, file or clock directly. A thin layer performs those operations in production, and the simulator handles them in tests, so the logic under test is the logic we ship.
During a run, clocks jump, messages arrive late, S3 responses stop halfway through, and daemons crash during operations. Disks fill up or lose files while several workers compete for the same cache. Throughout all of this, the simulator checks that every returned byte matches S3, that no worker ever sees a purged object, and that disk usage stays within budget.
Checking that the simulator works
We also need to check that the simulator detects the failures we care about:
- The simulator must reflect production’s constraints. It takes its timeouts from production defaults, and tests check that they do not drift toward more forgiving settings.
- Every new check must catch a planted bug. We deliberately break the relevant behavior and verify that the simulator detects it using the seeds run in CI.
- Runs must reach the difficult cases. We count evictions, timeouts and races, and require a minimum number of each. CI fails if a change stops the simulator from reaching those situations.
When a bug turns up elsewhere, we fix both the bug and the gap that let it escape the simulator.
CI runs tens of thousands of seeds on every pull request. Nightly tests explore new seeds, and we run larger tests on rented machines for bigger changes. Our latest extended test covered about 3.2 billion seeds over 24 hours without a failure.
What the failures taught us
During a daemon upgrade, workers can still hold files the old daemon passed them. A long simulation found a narrow window in which the daemon could acknowledge a purge while a worker still held stale data. We changed the daemon to wait until the maximum time a worker may hold a file had passed before acknowledging. The worker enforces that limit, so the simulator can check it.
The simulator’s timeouts hid another problem. Production let the daemon wait five seconds for S3, while the worker gave up after two. The simulator used a more forgiving arrangement, so it never showed us that slow S3 requests could make a healthy cache look unresponsive. A code review caught the mismatch. Requests now carry the worker’s deadline, and the daemon responds before it expires.
We also learned that correct reads are not enough during upgrades. An integration test found that a failed handover could leave a replacement daemon with an empty cache, even though the old daemon still had the data. Reads stayed correct because they fell back to S3. We now require rollouts to preserve the cache as well.
Sometimes testing pushed us toward a simpler design. We tried two ways to handle a shortage of fetch slots: adding a bounded wait and retry mechanism, or raising the limit. The retry mechanism exposed a real bug and several simulator false alarms. The larger limit performed about as well without adding another mechanism, so we shipped it.
What the load tests caught
Simulation only explores the world we describe to it. Each round of load testing exposed something the simulator had missed, and we fed each one back into it.
Reducing unnecessary S3 reads
At first, large scans went back to S3 too often. When fetch slots ran out, the daemon rejected requests, and the worker fetched the entire requested range again. We changed the worker to fetch only the missing portions and increased the limit to make rejections rare.
That exposed another problem. Queries reading nearby parts of a file shared one long S3 request, so each query waited for the bytes ahead of its own. The simulator had never delivered several readers’ requests together, as a real socket does. Once we added that behavior, it reproduced the slowdown. We fixed it by fetching shorter ranges in parallel.
Making fair comparisons
When first reads stayed slower than an earlier direct-S3 run, we first suspected the daemon’s S3 client. Testing direct S3 on the same host showed it was just as slow that day. S3’s own metrics confirmed that its time to first byte had grown by 30–40 ms.
We now compare on the same host and day, and check server-side latency before attributing a change to our code.
What comes next
Inertia now serves every node in our production cluster.
Since then we have shipped two more improvements that testing identified. A slow S3 request now triggers a second request, which cuts long waits for the first byte at the cost of a few percent more requests. Read-ahead now stays within the query’s requested blocks, which removed most of the wasted fetches at small cache sizes.
Next, we plan to cache files as soon as the query engine uploads them. We also plan to add a shared cache tier within each availability zone, so a worker starting on a fresh node can retrieve cached data over the network instead of starting with a cold S3 read.
If you want to see how this feels from the query side, the quick start gets a table into Hotdata in a few minutes.