
IoT
Query every device, site, and reading
Sensor readings by site, device, and time, next to the records that describe each device.
Your sources
Kafka
Object storage
Device registry
Your VPC
Hotdata
- Append history
- Latest state
- Time buckets
Used by
Fleet dashboards
Alerts
Product teams
Common workloads
- Fleet monitoring
- Latest readings and status for every device, and the ones that went quiet.
- 5×Faster than Snowflake, with 10 concurrent clients
- Site analytics
- Roll readings up by building, floor, and room over time.
- Device health
- Catch failing devices early from signal and power trends.
- 15×Faster than reading S3 directly →
- Product and field analysis
- Compare hardware versions and installations to see what works best in the field.
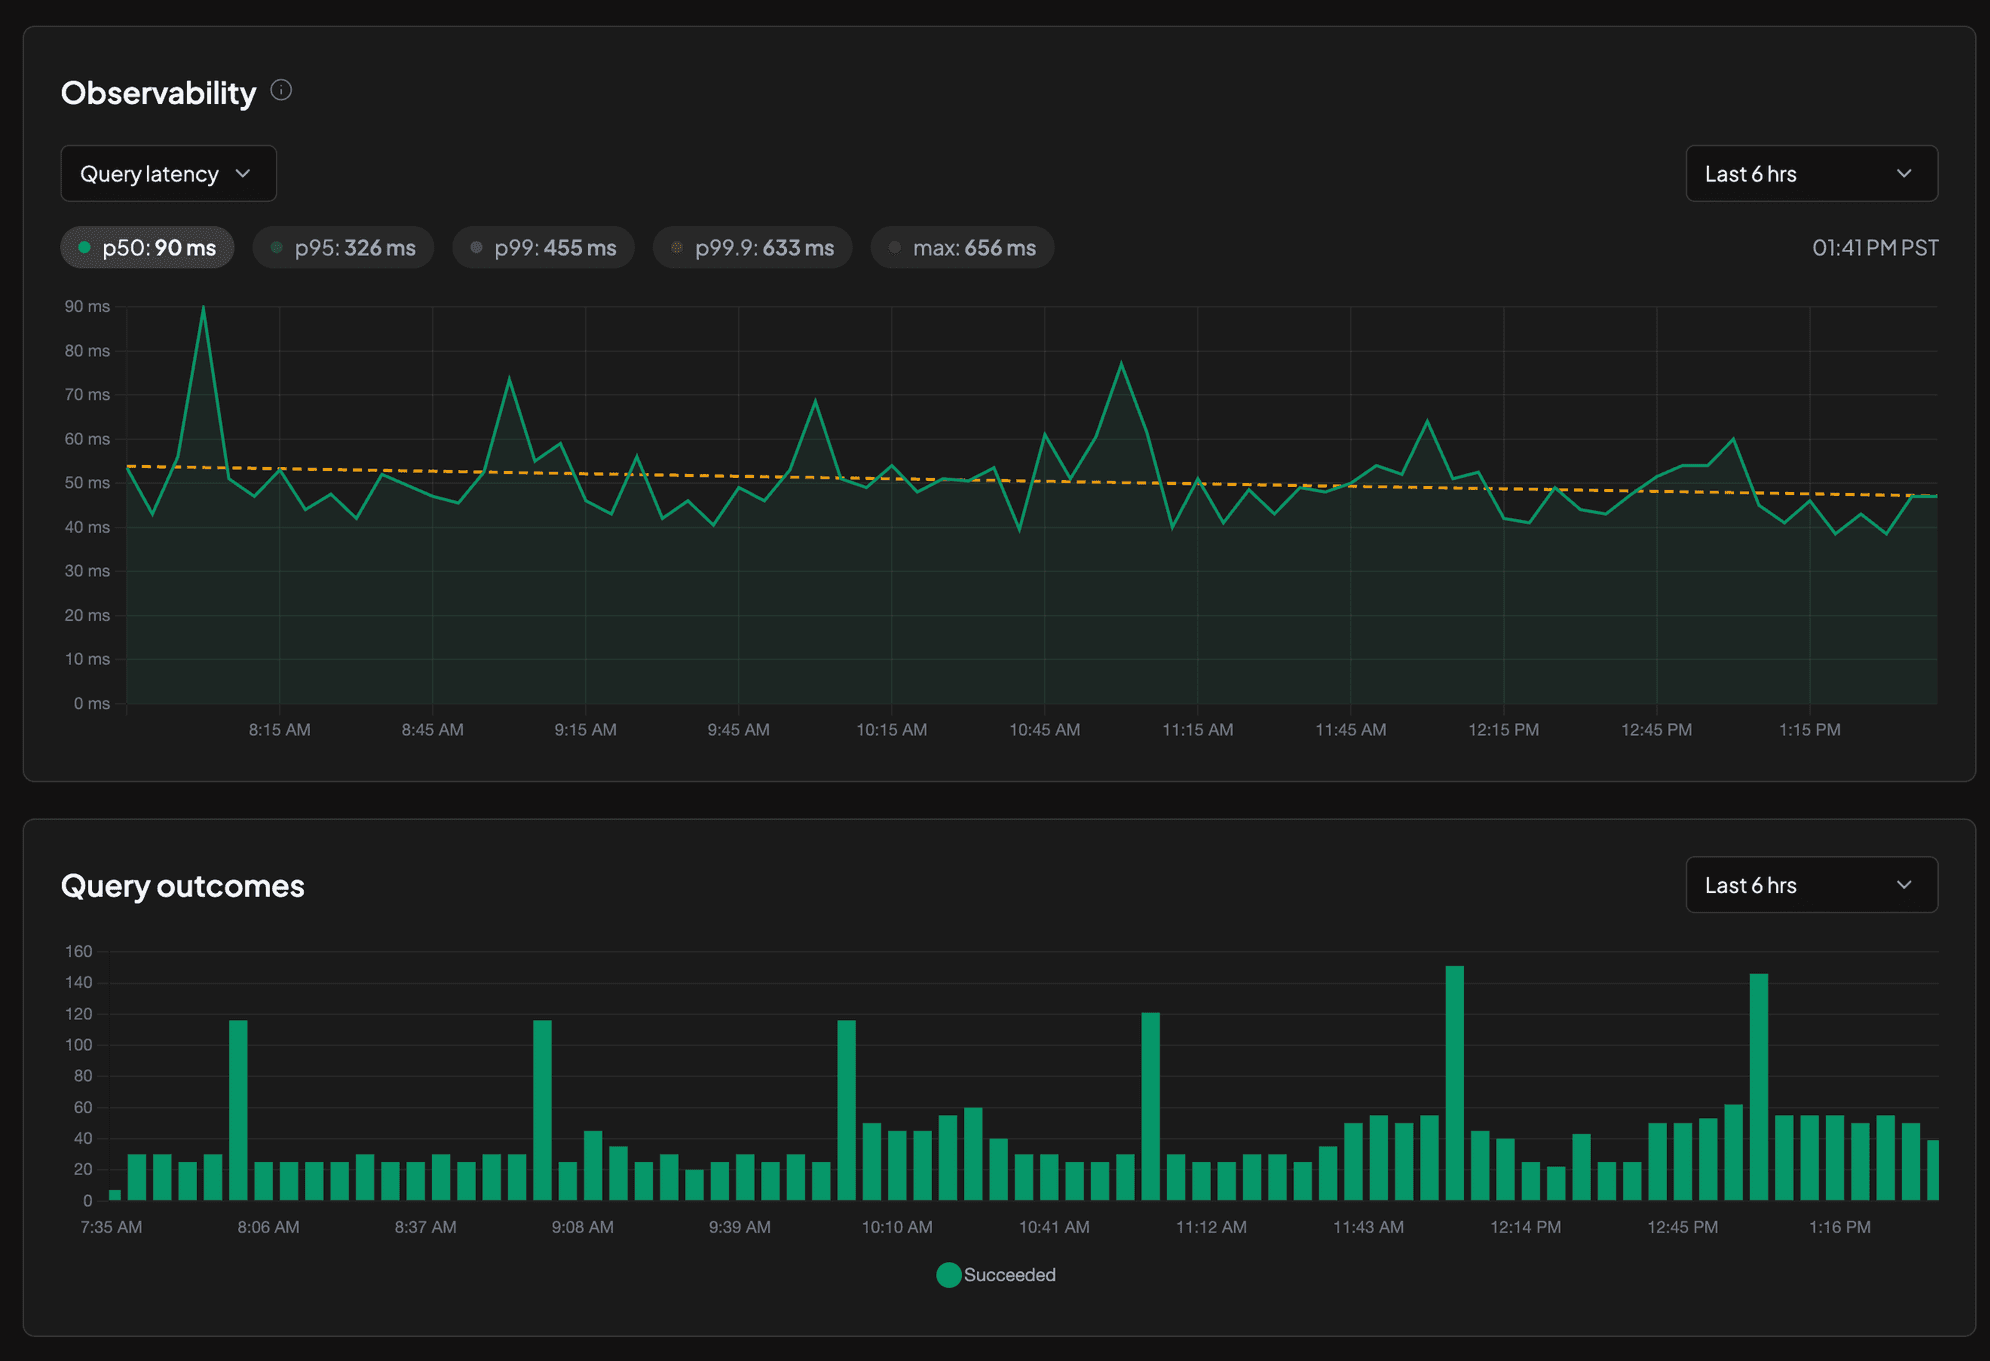
Built-in observability
See how your queries perform, right in the Hotdata console. Nothing extra to set up.
Deployed in your VPC
We deploy Hotdata into your own VPC and operate it for you. If you would rather not run any infrastructure, a fully managed option is also available.
- Security
- Your data stays in your own cloud account. You keep control of the infrastructure, access, and keys.
- Performance
- Hotdata runs in the same network as your databases and object storage, so reads stay inside your cloud.
How Hotdata fits
Load readings from where they land
Pull from Kafka topics, or Parquet, CSV, and JSONL in object storage.
Pull Data →History and current state side by side
Append readings for full history, and upsert each device's latest state.
Load modes →Join readings with device records
Query readings next to device, site, and installation records, in PostgreSQL, DuckDB, Snowflake, or ClickHouse SQL.
HotSQL →Time series in SQL
Downsample with date_bin and compare periods with window functions.
Date and time functions →Steady latency under load
With 10 concurrent clients, Hotdata runs 5× faster than Snowflake.