
Agent Analytics
Agent performance, cost, and failures in SQL
Search, join, and roll up every session, tool call, and model call.
Your sources
Agent sessions
Tool call logs
Customer database
Your VPC
Hotdata
- Full-text search
- Vector search
- Percentiles
Used by
Eval dashboards
Cost reports
Debugging agents
Common workloads
- Session analytics
- See where sessions finish and where users drop off.
- 5×Faster than Snowflake, with 10 concurrent clients
- Quality and evaluation
- Compare outcomes and latency before and after a prompt or model change.
- 4×Faster than BigQuery, at every concurrency level →
- Usage and cost per customer
- Tokens and spend by agent, model, customer, and day.
- Investigating failures
- Find the sessions that went wrong and the steps that led there.
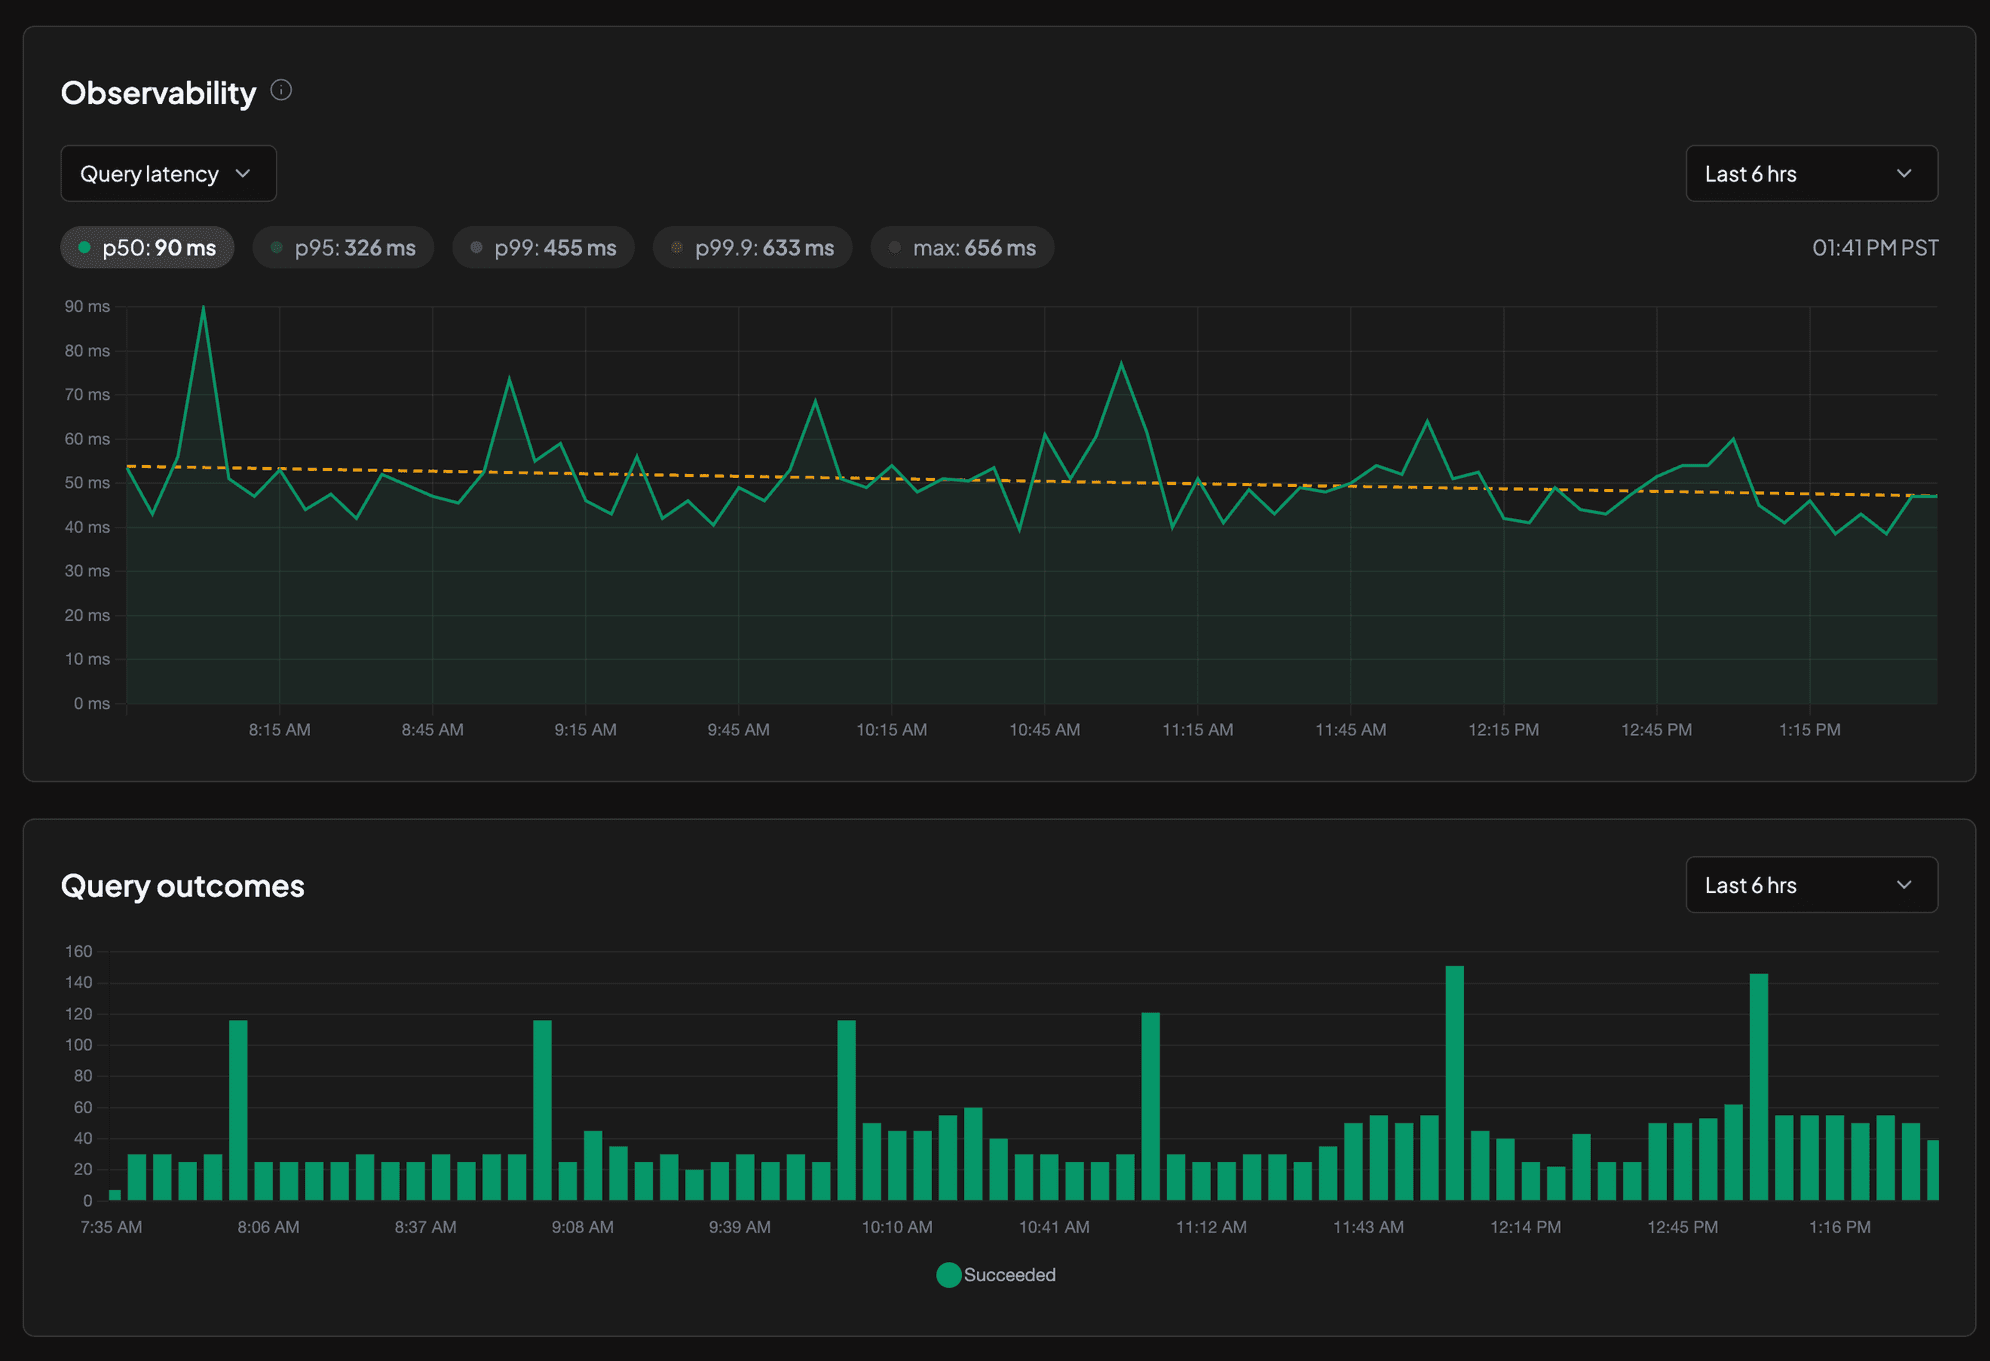
Built-in observability
See how your queries perform, right in the Hotdata console. Nothing extra to set up.
Deployed in your VPC
We deploy Hotdata into your own VPC and operate it for you. If you would rather not run any infrastructure, a fully managed option is also available.
- Security
- Your data stays in your own cloud account. You keep control of the infrastructure, access, and keys.
- Performance
- Hotdata runs in the same network as your databases and object storage, so reads stay inside your cloud.
How Hotdata fits
Append sessions as they finish
Append sessions and tool calls as they finish.
Load modes →Search transcripts in SQL
Find sessions by the text of a prompt, response, or error, filtered in the same query.
Full-text search →Find similar sessions
Find sessions like the one you are looking at.
Vector search →Percentiles and time buckets
Latency percentiles and time buckets in plain SQL.
Aggregate functions →Join with the rest of the business
Cost per customer is one query, in PostgreSQL, DuckDB, Snowflake, or ClickHouse SQL.
HotSQL →Many readers at once
With 10 concurrent clients, Hotdata runs 5× faster than Snowflake.